Sunday, September 23, 2012

Icon Sets
Icon sets is a function that allows you to easily tell if a cell contains a low, medium or high range of values by showing different icons in each cell.
With the Icon Sets…

  • You can specify a number of categories for the data (between three and five categories).
  • You can choose a set of icons that you want to appear in the cells for each category.
  • You can have Excel determine the categorization of each cell relative to all cells in the selected range so that it can draw the appropriate icon in the each of the cells.

You can use directional icons, shapes, indicators, ratings, and other rules.
Color Scales
Color scales compare values in selected cell ranges and display different colors. This function allows you to know if a number is in a high, medium or low range of values.
Example:

Data Bars
Data bars compare the cells in a selected range, and show ther values in a formed bars within each cell.

Example:
We want to highlight the 10 greater values with top/bottom rules, and we want data bars to be able to see the values in an easier way.


1. 

2. 

3.


Top/bottom Rules

We use this function to know which are the highter or lower values in a selected range. You can also use it to know which values are above or below average. And as in any of the options of Conditional Formatting, you can always change the criteria by clicking on More Rules. 


Example: 
Tutorial :


Highlight Cells Rules

Using this option you can highlight cells greater or less than especific number, between two values, equal to a value, or highlight text wich contains especific text. Also you can select a range and duplicate values.

Example:
Select the cells containing the data that you want to apply the rule on and go to Conditional Formatting ---> Highlight Cell  Rules---> More than ">"

Step 2. Select the conditions for the rule you want to set


You can set the rule the way you want to and there are many other options on Highlight Cell Rules.

Saturday, September 22, 2012

What is Conditional Formatting?


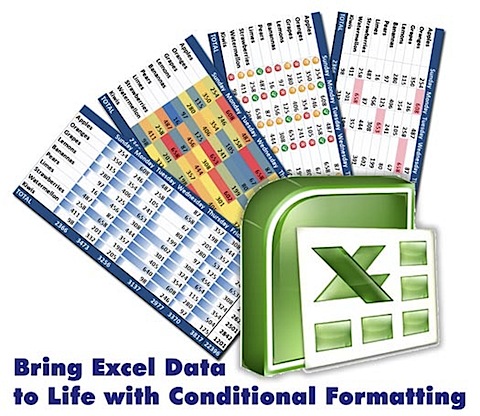
Conditional formatting is a feature that Excel has available for a better visualization of your data. It allows you to set rules for cell formatting and also add certain icons, color scales, data bars and more.